
Client Satisfaction
Our Ongoing Commitment to Client Experience Research
Over the past six years, we have maintained a continuous commitment to tracking our clients’ experience and acting on areas that need improvement. Our research partner has conducted more than 750 in-depth interviews with executives from recently closed transactions, capturing over 4,500 client satisfaction (or CSAT) data points to date. Each interview, lasting 20–40 minutes, collects a mix of qualitative feedback and quantitative metrics, covering the entire client experience—from the initial decision to award Houlihan Lokey the mandate, to their thoughts on interactions with our team, to the unfolding of the transaction.
At the end of each fiscal year, our research firm produces a comprehensive report that summarizes and analyzes our performance. This report is thoroughly reviewed by the CEO and the Corporate Finance leadership team to identify areas of excellence and those needing improvement. Acting on these insights is how we ensure our customer experience continues to strengthen.
Houlihan Lokey’s Cumulative Six-Year Client Satisfaction KPI Performance
Among the many facets of our Client Experience survey are three qualitative CSAT bellwethers we pay particular attention to, especially in years where market fluctuations are in play: overall client satisfaction, client satisfaction with transaction outcome, and client satisfaction with Houlihan Lokey’s ability to understand and respond to unique client needs.
Meeting or exceeding our clients’ expectations in these three areas is critically important because they speak to the heart of our singular focus: Put the client, and their success, at the center of everything we do.
Achieving a high satisfaction rating on transaction outcomes is easier when the market or the circumstances favor our client. But when this is not the case, a client’s outcome satisfaction rating speaks to how well we were able to advise, set expectations, find and leverage opportunities, negotiate, and offset disadvantages to achieve a better-than-expected outcome.
If there is one known constant in our business, it is that every client, their needs, and their circumstances are different—every time. For that reason, tracking our clients’ perspectives on our ability to consistently understand and be responsive to their unique needs is paramount to maintaining our focus on the client. Client satisfaction ratings in this area give us perspective on how well we are listening, understanding, and adapting ourselves and our services to each client and their unique needs.
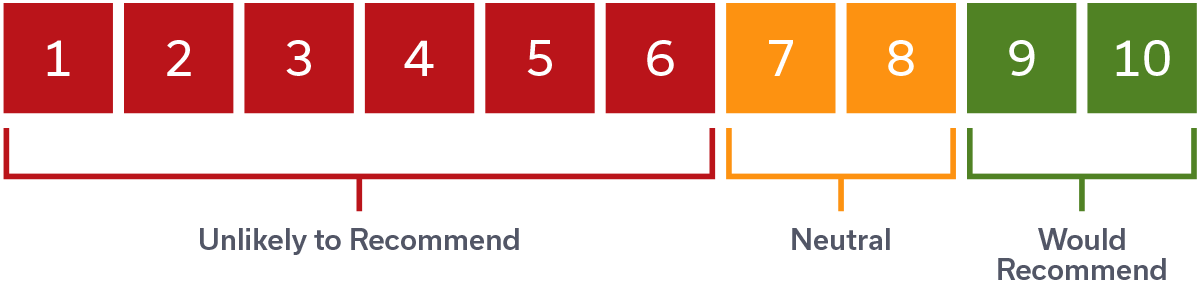
Both client satisfaction ratings are additionally important because we believe they are the underpinnings of the answer to “the ultimate question”: How likely are you to recommend Houlihan Lokey to a friend or colleague?
Understanding Net Promoter Score®
As with any services business, a recommendation or referral is the ultimate affirmation that not only were a client’s expectations met, but you have earned their trust to such a degree that they would recommend you to a friend or colleague. We refer to these types of clients as “promoters.”
To measure the degree to which we have earned a client’s trust and willingness to recommend our firm, we ask them the following:
On a scale of 1–10, with 10 being the highest, how likely are you to recommend Houlihan Lokey’s Corporate Finance services to a friend or colleague?
As we analyze the results, we view the scale in the following way:
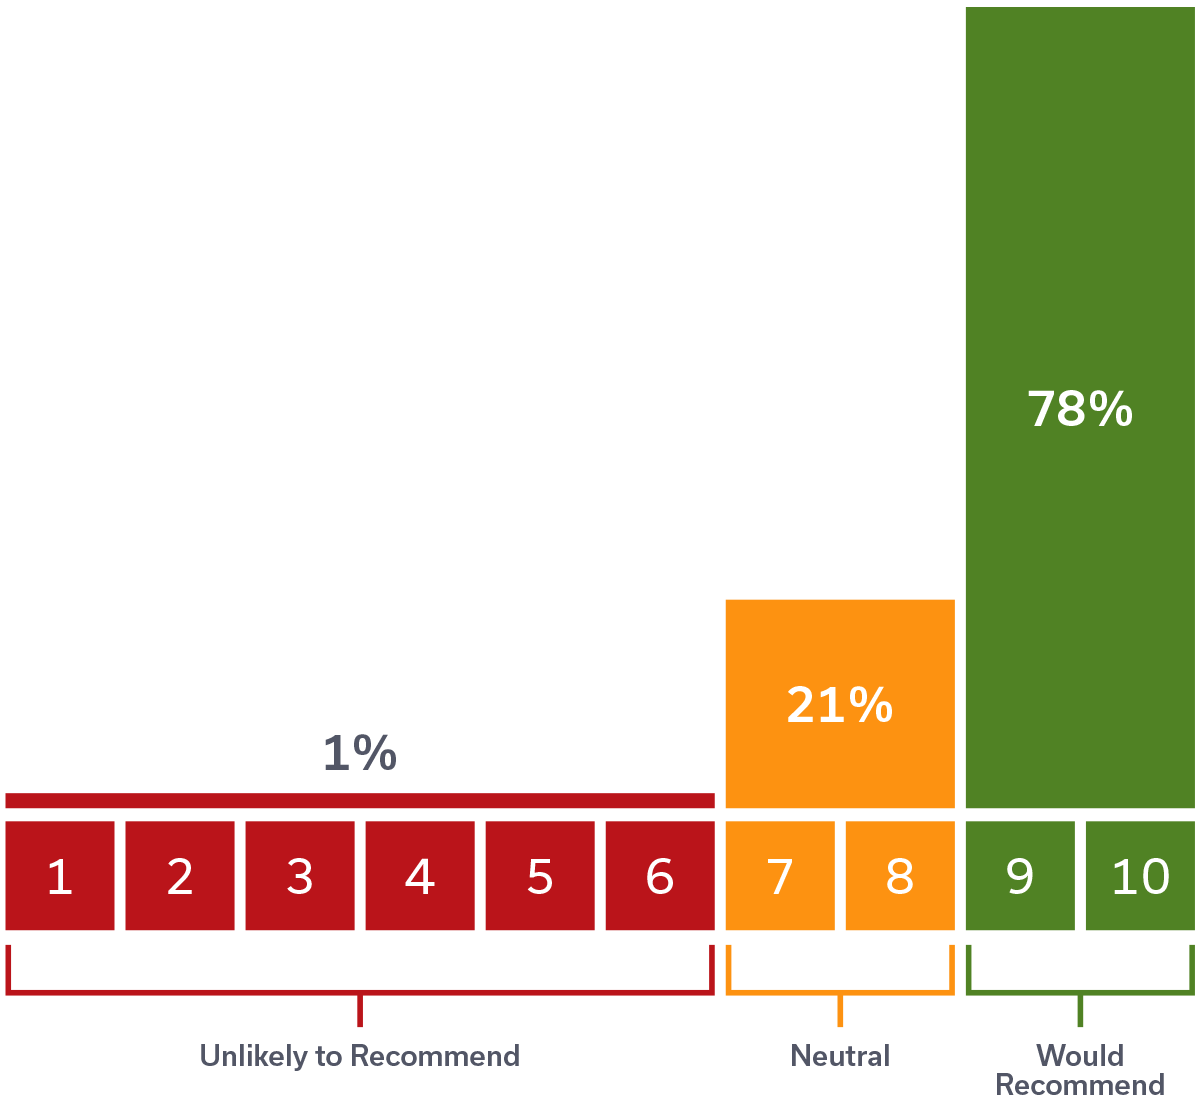
Six-Year Cumulative Net Promoter Score® Performance
Among the 750+ post-transaction clients who agreed to be interviewed over the course of the past six years, 78% (600+) said they “would recommend Houlihan Lokey” while only 1% said they were “unlikely to recommend us.”
- Total clients who would recommend Houlihan Lokey as a financial services partner – 78%
- 78% - Would Recommend (9 or 10 out of 10) or (608 out of 779 Clients)
- 21% - Might Recommend/Neutral (7–8 out of 10) or (164 out of 779 Clients)
- 1% - Unlikely to Recommend (1–6 out of 10) or (8 out of 779 Clients)
78%
Total Clients Who Would recommend Houlihan Lokey as a Financial Services Partner
Benchmarking Our Performance to Other Top Brands
Within the investment banking community, “league tables,” which total completed transactions in a variety of ways and are assembled by third parties such as LSEG (formerly Refinitiv), have traditionally been the only peer-to-peer comparison. However, they do not explain why more transactions are being done at one firm versus another.
As much as we would welcome a head-to-head comparison of our Net Promoter Score® and client advocacy scores to our direct peers in the same way league tables do, the investment banking services industry is not widely tracked by third parties in these ways, nor do any of our peers post their scores to our knowledge. Yet, how our clients feel about us relative to other well-known brands in other industries may provide some perspective on our consistent leadership position among league tables focused on transaction counts.
Comparing Our Six-Year Net Promoter Score®
+77
Net Promoter Score®, 2017–2023
Houlihan Lokey Net Promoter Score® Compared to Other Industries

Source for Net Client Advocacy Industry Comparisons: Delighted by Qualtrics®: Benchmarks by Industry.
The most common and universally applicable way to benchmark a company’s client satisfaction performance is to compare the net number of clients who are “willing to recommend your product or service to a friend or colleague.” The formula for getting a Net Promoter Score® is to subtract the total number of clients who are “unlikely to recommend” from the total number of clients who are “willing to recommend,” while disregarding those who are “neutral.”
For example, if a company has 25 clients who are “willing to recommend” a company’s product or service, 40 clients who are “neutral,” and 35 who are “unlikely to recommend” the company, then that company would have a Net Promoter Score® of -10 for the year (25 - 35 = -10).
In our case, our cumulative six-year Net Promoter Score® is +77, which is achieved by subtracting the 1% of surveyed clients who said they are unlikely to recommend from the 78% of surveyed clients who are willing to recommend us.
Comparing our six-year Net Promoter Score® of +77 to other top brands and industries can be challenging as these scores are rarely published by companies who track them, and the source data behind many third parties who generate benchmark reports can be questionable. However, some companies who gather CSAT data on behalf of clients, like Delighted by Qualtrics®, which tracks customer service metrics on behalf of +75,000 clients, do produce reliable industry benchmarks and ranges because they are based on the results of their actual clients. Even though the actual 1:1 scores of their clients within an industry benchmark range are not provided, the names of many companies whose scores contribute to the range are listed.
If you want to see how our +77 score compares, feel free to do so in Delighted’s Benchmarks by Industry tool.
Net Promoter, NPS®, NPS Prism, and the NPS-related emoticons are registered trademarks of Bain & Company, Inc., NICE Systems, Inc., and Fred Reichheld. Net Promoter ScoreSM and Net Promoter SystemSM are service marks of Bain & Company, Inc., NICE Systems, Inc., and Fred Reichheld.
All logos and trademarks displayed are the property of their respective owners. The use of these logos and trademarks is for informational purposes only and does not imply endorsement, sponsorship, or affiliation with the respective companies, including Adobe, Microsoft, Sony, and Google. ©2025 Houlihan Lokey. All rights reserved.