Study 1: How Do Yields Vary by Size of Borrower?
We have been producing the PPCI for several quarters using a dataset of instruments we have valued since Q3 2017. Clients have asked us for a variety of data insights, and the question of whether different size loans persistently yield more has been common. To answer this, we turned to the same dataset we use to compute the quarterly index but created quartile subindices for comparison purposes.
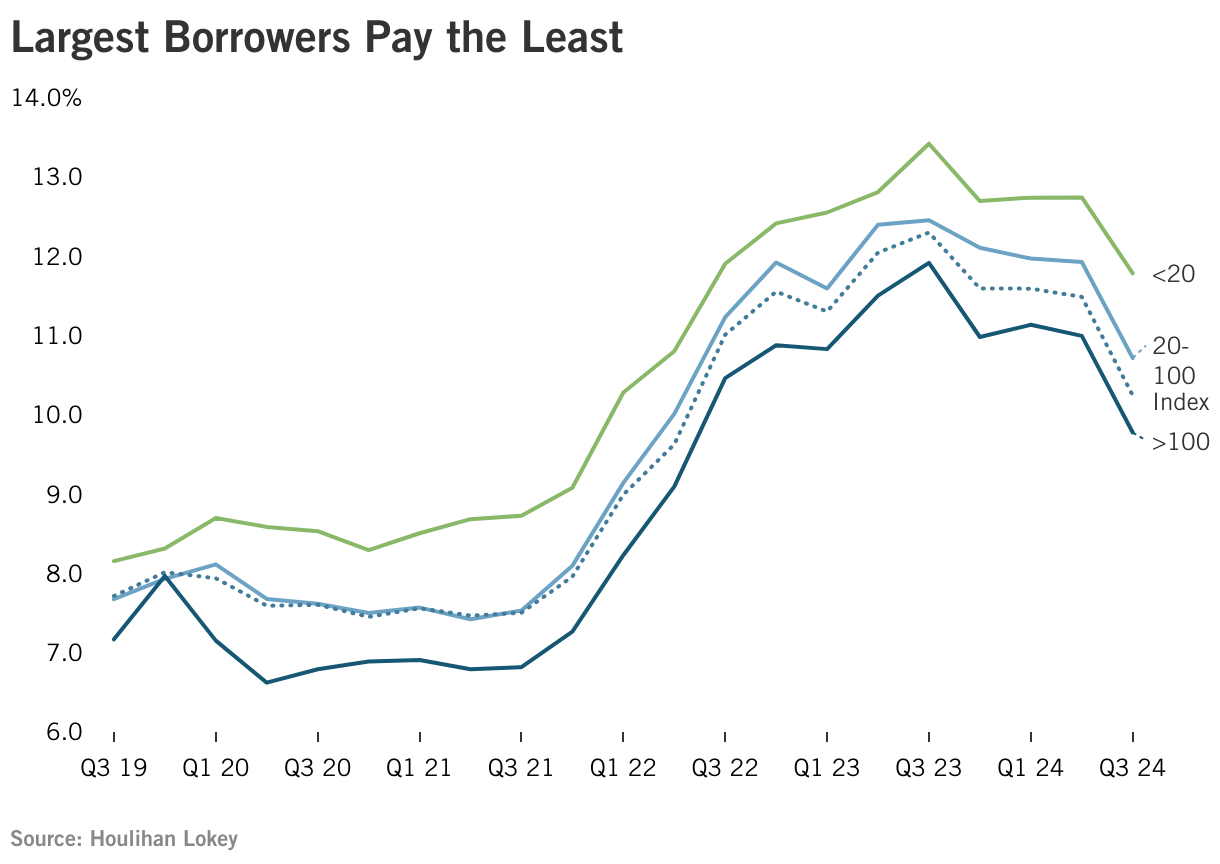
The answer to that question is yes: There are trends and conclusions, but it is not a simple response. We stratified the data into quartiles based on adjusted EBITDA—breakpoints of less than $20 million, $20 million to $100 million, and above $100 million. The periods prior to and since COVID-19 display marked differences, but the loans to the smallest borrowers do persistently have the highest yields. The loans to the largest borrowers have the lowest yields, although that is most pronounced since Q2 2019. It is important to note that these yields represent the weighted average yield of loans we value each quarter and are not a measure of total return or historical performance. Rather, the yield is a snapshot at each point in time. Furthermore, all the loans in the PPCI are performing loans, so these yields do not reflect the impact of underperforming or defaulted loans.
The average of the entire dataset is presented as subindex average. For computational reasons, that average is not exactly the same as the PPCI, but the comparison between quartiles is accurate.
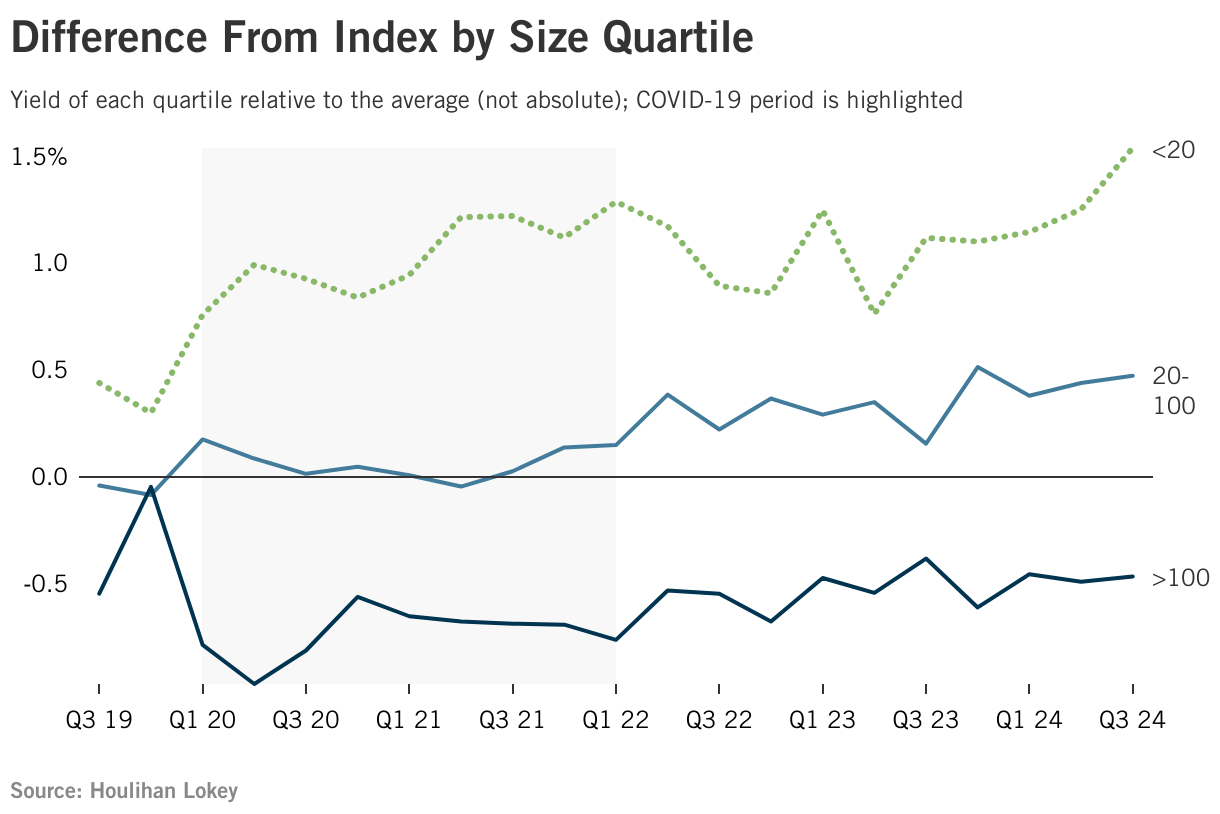
By examining the quartiles relative to the subindex average, that same observation is easier to see. While the largest borrowers are routinely +/- 25 bps from the average, the smallest borrowers have been more than 100 bps above average in the past several quarters.
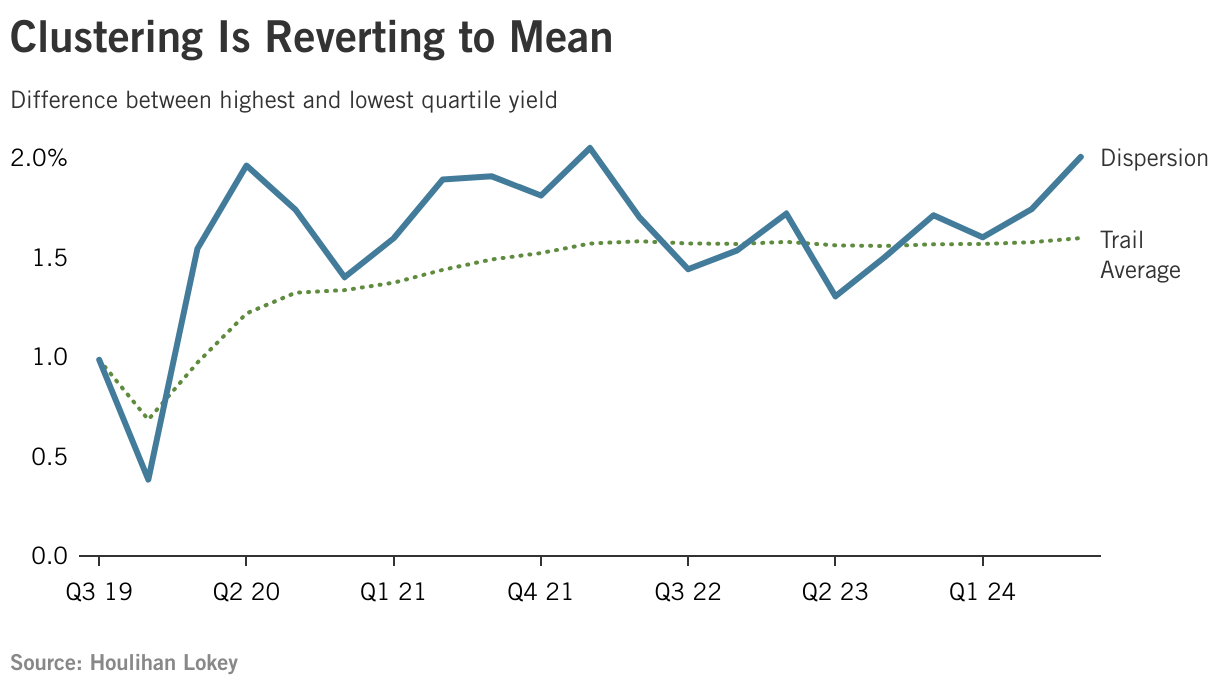
The overall divergence between quartiles is also dynamic and has moved wider and tighter over time. This graphic shows the dispersion as the highest quartile yield minus the lowest quartile yield. The trailing average of dispersion also shows an increase, as yields continuously reflect size premiums or discounts.
Conclusions and Observations
This is the simple answer to the question, “How do yields vary by size of borrower?”: There is a wide variation in the dispersion of yields relative to size, but loans to the smallest borrowers consistently have the higher yields. These higher yields may be required to compensate lenders for the increase in execution costs for a larger number of transactions. Additionally, smaller borrowers may be perceived to have more credit risk than larger borrowers, thus justifying a higher required yield for loans to small borrowers.
It seems clear that competing strategies of lending to small borrowers and lending to large borrowers can both be successful if managed appropriately.
Contacts
-
Dr. Cindy Ma Managing Director Global Head of Portfolio Valuation and Fund Advisory Services

-
Chris Cessna, CPA, CFA Director

-
Joseph Cristantiello Senior Vice President