Study 2: Can You Break Down the PPCI to Explain Changes?
Each quarter, we calculate the PPCI from the instruments valued in our automated systems. However, we also produce other aggregated statistics, such as weighted average spread or coupon. An examination of the relationship between these metrics and benchmark rate and average price can explain the market dynamics and the differences between public and private credit instruments.
Component Metrics
- Coupon is the coupon used to determine the cash flow for each instrument and does not include the benchmark rate. It is calculated as a principal weighted average. The entire instrument cash flow does include benchmark rate in the valuation calculation.
- Spread is the rate added to the benchmark rate used to discount the cash flows back to a price. For loan valuation, spread is determined by multiple factors by the valuation agent.
- Benchmark rate is typically SOFR or LIBOR and is computed in our models as a forward rate derived from the active swap curve. For our decomposition analysis, we use the swap rate best related to the weighted average life of the valued instruments—typically four years.
- Price is the instrument price after all factors have been incorporated. Typically expressed as a percentage of par, price is also shown as the amount of discount to par to facilitate display. The change in the component metrics is what drives changes in price. We show price as a change in percentage of par.
- Composition is the measurement of the change in PPCI relative to the change in the portfolio of valued instruments.
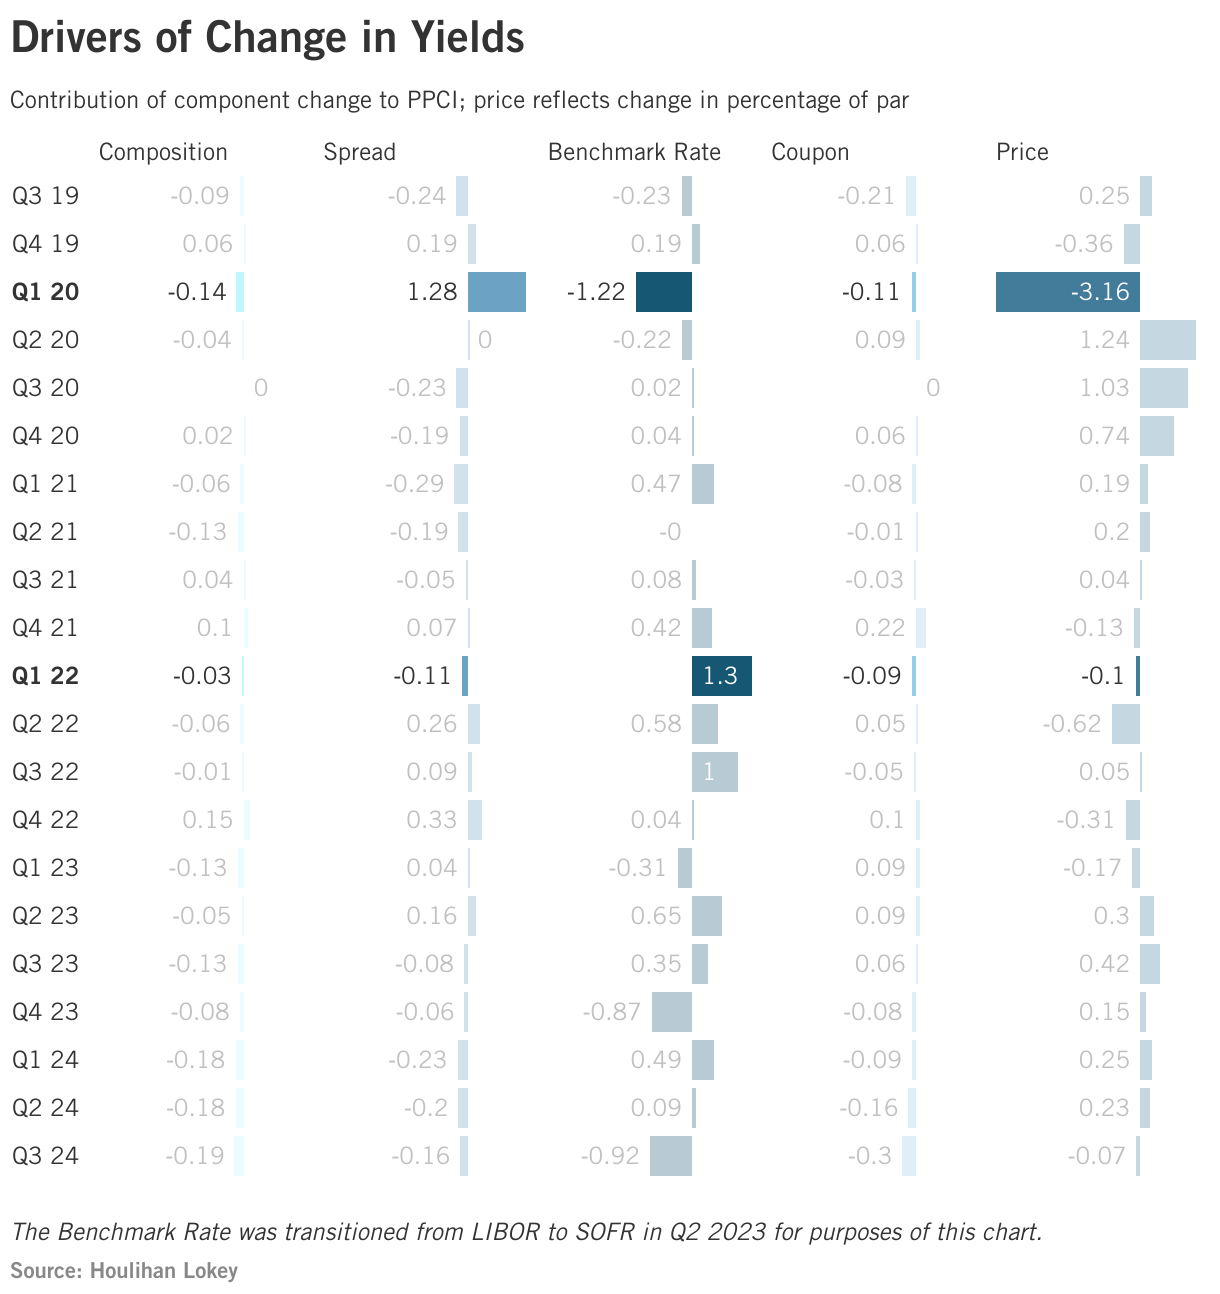
In the chart above, we illustrate the relationships between these metrics in the highlighted period. Spread and price have an inverse relationship; when the spread increases, the price decreases, all else equal. During the valuation process, we take into consideration changes in market spreads and yields. We evaluate portfolio company performance, including relevant credit metrics, to determine an appropriate spread to apply to the cash flows. Despite the relationships, the calculation methodologies prevent a conclusive summation of the components to exactly explain the results of any period. The first bullet highlights this:
- Q1 ’22: This period saw a large increase in the benchmark rate, but since there were only slight changes in spread and coupon, there was almost no change in price.

The chart above highlights the dynamic relationship between price, spread, and coupon. Price, expressed as a discount from par, shows a strong inverse relationship with spread, meaning that as spread decreases, price increases, assuming other factors remain constant. Coupons, calculated as the principal-weighted average and excluding the benchmark rate, have been trending downward over recent quarters. This trend suggests that new issue coupons are being set lower, potentially reflecting tighter spreads and a more competitive lending environment among lenders.
Spread, defined as the rate added to the benchmark rate to discount cash flows to a price, is influenced by various factors determined by the valuation agent. As spreads tighten, prices tend to rise due to the direct mathematical relationship between discount rates and present value. This inverse relationship between spread and price is the strongest driver of price changes observed in the chart.
In addition, benchmark rates and their corresponding floors can significantly influence price variability. These factors affect the discounting process and interact with duration and volatility considerations, contributing to shifts in pricing dynamics.
While price incorporates multiple factors, including the benchmark rate, spread, and specific instrument characteristics, the observed trends in spread and coupon provide substantial explanatory power for price movements. However, additional elements, such as benchmark rate floors, duration effects, prepayment options, and broader market conditions, may also influence price variability.
For a more in-depth discussion of these relationships and their impact on loan valuation, please feel free to contact us.
Contacts
-
Dr. Cindy Ma Managing Director Global Head of Portfolio Valuation and Fund Advisory Services

-
Chris Cessna, CPA, CFA Director

-
Joseph Cristantiello Senior Vice President